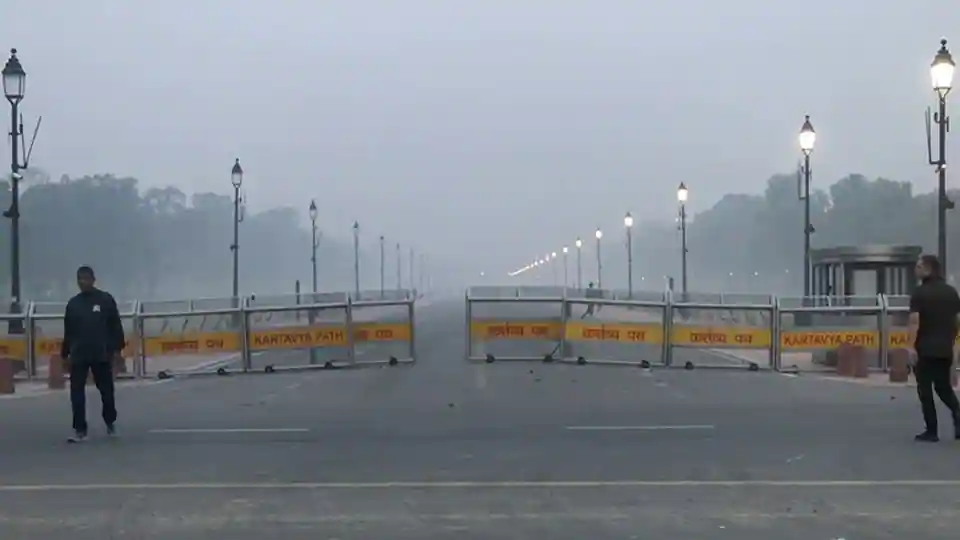
Delhi’s air turned “severe”, the worst grade on the government’s pollution scale, at 6am on Friday on the same 39 monitoring stations the city had last Diwali, an HT analysis of Central Pollution Control Board (CPCB) data shows.
The official index averages the past 24 hours, so it smooths out swings and is slow to show a rise this fast. When HT scored each hour on its own, as if that hour’s air held for a full day, every hour since 8pm on Thursday came out “severe” on all 59 of today’s stations. The 10am score was 453 on the 0-500 index, against the official 391, and the official figure will move towards it if the air stays this dirty.
The new stations also hold the official figure down, because several of the 20 added since last Diwali read well below the older stations around them. On the 39 stations that reported last Diwali, the 10am figure was 407.
How bad it is
At 10am, the typical Delhi station recorded 335 micrograms of PM2.5 per cubic metre of air, more than five times India’s limit of 60 for a day’s average. PM2.5 is fine particles small enough to lodge deep in the lungs. That level is well inside CPCB’s “severe” band for PM2.5, which begins at 250. CPCB says air in that band affects healthy people and seriously affects people who already have an illness. Forty-one of Delhi’s 59 stations, about seven in ten, were past that line.
The pollution has built up over two still nights. The typical reading more than doubled from Wednesday afternoon to Friday morning, with only a partial clearing on Thursday afternoon.
To see the AQI at the station nearest to your location in Delhi-NCR, open the HT Pollution dashboard at
Major surge in farm fires
Farm fires in Punjab and Haryana are surging late in the afternoon, after the satellite behind the usual count has passed. INSAT-3DS, an Indian satellite that scans the region every half hour, saw its daily count grow more than four and a half times from Sunday to Thursday, and spotted almost all of those fires between 4pm and 6pm.
The count usually quoted, which Nasa publishes, comes from a satellite that passes over Punjab once in daylight, at about 2pm. It grew by only about 60% over the same days. By that count this has been a light season. It recorded 184 fires a day in the week to Thursday, close to last year’s 200, half of 2024’s 388, and far below the several thousand a day of 2018-2022.
The two satellites detect fires in different ways, so their growth can be compared but their totals cannot. Nasa’s count is accurate for what it measures, fires burning at about 2pm. Fires lit after the satellite has passed don’t show up in it, and they may now be a large and growing share of the burning.
The wind has been coming from the same direction as the fires. Smoke travels between regions on the transport-level winds, one to three kilometres above the ground. These have blown from the north-west, from Punjab and Haryana, almost without a break since October 31, and have strengthened to about 36 km/h. That wind would carry smoke from the fire belt towards Delhi. The readings cannot show how much of it reached the city.
No relief from the weather during the festive rush
There has been no wind at ground level to clear the air, and pre-Diwali traffic has jammed the city’s roads for days. Safdarjung reported dead calm through most of Thursday night. Every morning this week, a layer of warmer air a couple of hundred metres up has worked like a lid, keeping the night’s pollution close to the ground. On a typical early-November afternoon, the sun breaks that lid and spreads pollution through about 1,300 metres of air. This week the pollution spread only 600 to 800 metres up, so the same pollution was packed into about half the usual space. Exhaust from the traffic, and the rest of Delhi’s own emissions, build up in that shallow layer.
Friday is Dhanteras and Diwali falls on Sunday. Every reading here was taken before the festivities began. INSAT’s count of Friday afternoon’s fires will be available tonight.
About this analysis
PM2.5 figures are CPCB’s measured hourly readings for all 59 Delhi stations, from its Central Control Room portal, read at 10.41am on Friday. “Typical station” means the median, the middle reading when the stations are ranked. The hourly score is HT’s calculation, not CPCB’s: it applies CPCB’s cut-off values for PM2.5 and PM10 to each hour’s readings and averages the stations, as CPCB does for the city. The 24-hour figures use the station indices CPCB publishes. Averaged, they match CPCB’s Delhi figure in all 203 hours HT checked since October 29.
The 13 stations the Delhi Pollution Control Committee added in October read about a third below their neighbours, an earlier HT analysis found, for reasons not yet explained.
The data do not show what share of Delhi’s pollution comes from farm fires. INSAT counts are compared only within this season, because its counts for the same dates in 2025 run far higher for reasons not yet explained. Nasa counts cover Punjab and Haryana, nominal and high confidence, with fixed hot spots such as factories left out. Winds come from the India Meteorological Department’s balloon soundings and airport reports at Safdarjung.